 | Nix Data Science | 273 Members |
| 57 Servers |
| Nix Data Science | 273 Members |
| 57 Servers |
| Sender | Message | Time |
|---|---|---|
| 16 Aug 2023 | ||
 rvlobato joined the room. rvlobato joined the room. | 00:50:07 | |
| 20 Aug 2023 | ||
 isomorph70 set a profile picture. isomorph70 set a profile picture. | 07:57:56 | |
| 23 Aug 2023 | ||
 Vitali Bohush joined the room. Vitali Bohush joined the room. | 12:55:18 | |
| 24 Aug 2023 | ||
 Florian joined the room. Florian joined the room. | 09:57:53 | |
| 27 Aug 2023 | ||
 Bruno Rodrigues Bruno Rodrigues | hi all, just saw this on twitter, might be of interest to this group: https://twitter.com/DeterminateSys/status/1695567786309783819?s=20 | 21:21:31 |
| 28 Aug 2023 | ||
 CRTified joined the room. CRTified joined the room. | 19:13:30 | |
| CRTified | Hey, I'm currently trying to setup a slurm cluster and want to run a test within a VM. Having no state, I am always met with this failure, which is fixed after one restart (leading to other errors, which is fixed by a second restart): | 19:25:14 |
| CRTified | 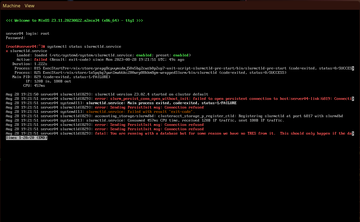 Download image.png | 19:25:21 |
| CRTified | Apparently, slurmdbd is not running when slurmctld gets started, but even after putting slurmdbd in the require and after fields of the slurmctld unit, this behaviour appears | 19:26:14 |
| CRTified | The relevant config for | 19:28:39 |
| CRTified | * The relevant config for | 19:28:51 |
| CRTified | * The relevant config for | 19:29:26 |
| CRTified | oh wait, it's possible that slurm is not that common in data science and this is the wrong channel, or? | 19:29:55 |
| CRTified | (Oh wow, sleep 10 in the preStart is sufficient to make it work...) | 20:18:00 |
| CRTified | sleep 1 suffices and is not that painful, so I'll keep that in it | 20:30:40 |
| 30 Aug 2023 | ||
 maupind joined the room. maupind joined the room. | 15:16:50 | |
| maupind | Does anyone here have good experience developing shiny apps? | 15:17:22 |
| 31 Aug 2023 | ||
| Bruno Rodrigues | I've built some, but am no expert | 15:31:04 |
| Bruno Rodrigues | but ask away maybe I can help | 15:31:18 |
| 1 Sep 2023 | ||
| maupind | In reply to @brodriguesco:matrix.orgThanks Bruno! I've trained multiple XG models looking at assessors performance and outcomes. I've created a few SHAP graphs using the shapviz package and would like to create a shiny app that people can use to explore the information rather than emailing multiple graphs. Ideally, I'd have a UI element to choose an assessor, and another UI element to choose the type of graph. For the first graph (overall importance) this seems like it should be straightforward, using some ifelse statements to line up if assessor 1 is chosen display assessor 1 importance graph | 08:59:12 |
| maupind | However, I'd also like to display dependence plots where you have to choose a variable to display, and I am not sure how to go about writing a function that would state if variable X is chosen, create the dependence plot using variable X | 09:00:18 |
| maupind | Not sure if this is important, but the shapviz packages first needs to create an object (calculates the shap values) and then this object is used to create plots. So Assessor A would have a shap object A and from this object you can create an importance plot and/or a dependence plot using some variable i | 09:01:42 |
| Bruno Rodrigues | this sounds like you need conditional UI rendering? | 10:29:56 |
| Bruno Rodrigues | https://mastering-shiny.org/action-dynamic.html | 10:29:57 |
| Bruno Rodrigues | So you likely need to render the UI server side | 10:30:19 |
| Bruno Rodrigues | you'll likely get more help in the posit Forums though https://community.rstudio.com/ | 10:31:08 |
| Bruno Rodrigues | try to post a minimal reproducible example of what you're looking for | 10:33:44 |
| maupind | Bruno Rodrigues: awesome, thank you! This is definitely a good start and I'll explore this and before trying Posit | 10:37:57 |
| 3 Sep 2023 | ||
| Bruno Rodrigues | friends, what do you use to build pipelines that integrate will with Nix? something that would let you build an environment and run a pipeline as simple as possible? me, coming from R I'm adding the command to run the pipeline in the shellHook of a shell (typically targets::tar_make) | 14:04:29 |
| Bruno Rodrigues | sou dropping in the shell starts the pipeline and then let's me explore the results | 14:05:00 |